Additional Information
Survey Summaries
The ITRC survey results are detailed in the PDF file below:
![]() Summaries of ITRC Institutional Controls Survey Questions
Summaries of ITRC Institutional Controls Survey Questions
State-Specific Survey Response
The state-specific responses to the ITRC survey are included in the PDF file below:
![]() Responses specific to each Respondent to the ITRC State Survey
Responses specific to each Respondent to the ITRC State Survey
Data Management
IC management uses considerable data during implementation, assembling a registry, monitoring, outreach and enforcement. While other sections of this document have explained the user’s “front-end” experience applying web-based services to manage ICs, this appendix describes the attributes needed for the “back-end” of any management program and the web traffic optimization encompasses activities to increase the traffic and use of the web and data resources created.
IC Database Management and Web Traffic Optimization
The purpose of a back-end data-base management system (DBMS) is to store and transform data into information to support making decisions by the agencies and private and public stakeholders. Often geographic information systems (GIS) augment the DBMS to provide mapping associated with IC management to web services which can then mediate communication and other functions to support IC management
The purpose of web traffic optimization is to increase the discovery and traffic to the institutional control website. This discussion extends the overview presented in Stakeholder Perspectives. In essence, once the data are well formed and displayed, the user base should be extended to benefit from the effort.
This appendix provides an overview of data management and web traffic optimization for ICs to allow program managers to engage with IT staff toward bringing necessary data management to support implementation of ICs. Therefore, the discussion is more technical, and forges a communication bridge between program and IT staff.
Purpose of IC Data Management
There are multiple roles associated with IC data management. It is important that IC information is maintained accurately, changes tracked, and documents retained throughout the life of the IC. Ideally, the ability to share data across different levels of government and stakeholders will continue to be developed and will ultimately result in more effective ICs. Effective data management includes the following elements:
- maintaining security of data
- meeting the needs of multiple user roles
- maintaining data integrity and durability
- providing accessibility by disability and language
- exchanging and sharing of data to government and public use
- responding to web service data request protocols
- complying with IC data schemas
- utilizing geospatial attributes including polygonal attributes
Ultimately most users will not be aware of the underlying data management, but the ease and trust of the interaction will be enabled by achieving, as practical, this data management vision.
Program Elements for IC Data Management
The data management for ICs is characterized in five program elements highlighted in Red on Figure 10 below. As indicated most of the data management elements are in the “back-end” behind firewalls that preserve the security of the data. Users within an agency would access the data through the agencies local area network (LAN) while public and other third parties would access the data across the Internet.

Figure 10. Program elements of an IC data management system.
Database Management Systems (DBMS)
A DBMS provides automated methods to create, store and retrieve data. It may take some time to set up these methods, but once in place, a DBMS can streamline tedious manual tasks. The DBMS is one component of data management, but is critical as this is the infrastructure upon which other data management elements are implemented.
An IC DBMS can take several forms. The cataloging of ICs at its simplest can be contained in a spreadsheet. However, the demands of an organization soon dictate multiuser access to a server-based DBMS. Additionally, the characteristics of ICs soon demand a one-to-many relational database that allows one IC to be connected to many stakeholders or too many restrictions. Finally, that geographic locations are material to an IC, a geospatial DBMS can store the geographic boundaries of the ICs or ECs.
The IC DBMS is often part of a larger departmental DBMS. An environmental management DBMS may have the IC management be one element of the program. At times multiple DBMS may be used. One DBMS may store documents, another geospatial descriptions, and another may act as an exchange between government servers. All the DBMS’s are synched using common data keys residing on each DBMS.
Geographical Information Systems
A geographic information system (GIS) is a system designed to capture, store, manipulate, analyze, manage, and present all types of spatial or geographical data. Geographic features associated with IC management include the boundary of the IC, the boundary of an engineering control, the boundary of the site, the restricted areas, the parcel boundaries, and the locations of land activity and uses affecting IC or EC effectiveness such as excavations, sensitive use, water wells or zoning.
IC features vary in their geometry. IC and EC boundaries are represented as a “polygon” feature, an” excavation” extent as a line feature, while a water well as a “point” feature. These geometries are located in geospatial projections. Projections can be planar such as state plane, which are represented in feet distances, or the projections can be geometric where distances are represented in decimal degrees. Often state agencies may use a state plane projection as the accuracy of the location is superior, and comparing distances in feet is more intuitive. A limitation is that one state’s projection is not transferable to another state. For this reason, large coverage mapping systems such as Google Maps or Microsoft Bing rely on a geographic projection. In fact they rely on one common data projection called WGS 84. As IC data are aggregated or shared, realizing what the projection is will facilitate moving IC data between mapping systems using different projections.
Often when ICs are received by the agency they are not in a geographic format, but described in legal descriptions such as “metes and bounds”. Bringing legal descriptions into a geometric description can be tedious and require access to records at a local recording office or field surveying to resolve the locations.
Geographic Information Systems (GIS) add a data field often deemed a “geom” that contains a polygon, line, or point. There are also geoms that are multipolygons applicable to a situation where one IC might encompass two noncontiguous parcels. The GIS data can be accessed with client software like ArcGIS and QGIS. A server such as ArcGIS server or PostgreSQL/PostGIS allow multiuser access to a geographic data.
Data Schemas for IC Management
A data schema is the architecture of how IC data are stored. The schema contains a logical hierarchy, often described as parent-child relationships, to provide an organization to the data (Figure 11). The schema is not the IC data, but rather how the data are organized. With an organized data schema, IC data can be shared between interested stakeholders.
A data schema is an inherent element of a data management system. Having well thought-out data schemas assures that all IC data can be managed. The agency DBMS likely manages more than IC data, so the IC data schema may exist inside a larger data schema for the agency’s environmental data; see Figure 11.

Figure 11. Data schema for a DBMS.
Source Bob Wenzlau, Terradex.
In 2002, USEPA recognized that ICs would be most effective if the data could be shared between agencies and other interested parties. To share the data, a common IC data schema was envisioned. The IC data schema was formed by the participation of federal, state and public stakeholders. While the data objectives for the IC schema were set, it was not finished until 2012, when Ohio and Indiana completed the full schema. On June 10, 2013 the Environmental Information Exchange Network (EIEN) announced the release of an IC Data Exchange. The IC Data Exchange provides a standard means for sharing IC information between separately-owned computer systems. A graphical model of the IC data schema is show in Figure 12 below:

Figure 12. Ohio and Indiana data schema, June 2013.
Source: Bob Wenzlau, Terradex.
The IC data schema shows the parent-child data relationships. The schema conforms to an organizational logic of ICs assembled across the stakeholder meetings. The top element is the instrument that is either the proprietary control, governmental control, or enforcement document. Therefore, the schema accommodates that one IC instrument might be relied upon by multiple sites (as in the case of a groundwater use ordinance), or that one site may have multiple IC (as in the case when multiple proprietary controls are issued to cover a single site.) The IC location information is parallel to the instrument because a location may be relied upon multiple times as in the case when a site boundary may coincide with an IC boundary.
The child elements of the IC instrument contain the following information:
- objective, providing a general state of the IC objective
- media, characterizing the media affected by the restriction
- use restriction, applying a standardized listing of activity and use restrictions
- contaminant, summary of contaminants relevant to the IC
- engineering control, providing additional characterization when an engineering control is part of the IC
- affiliates, providing identification to contacts participant in the IC implementation
- resources, showing links to documents including the IC instrument.
- events, scheduling single and recurring events that would typically be affirmative obligations associated with the IC
The child elements of the IC Location coincide with the multiple possibilities to describe the location of the IC including parcel designations, facility identification number or geographic locations.
A database used by an agency may not necessarily need to store the data into a data table structure that coincides with the IC data schema. However, as data are shared, the IC data may be transformed “on the fly” to coincide with the IC data schema. Once transformed to the schema, the data can be shared. This is an approach common to the Environmental Data Exchange.
When IC data are shared in the data schema, the data are shared in a format known as XML. XML is a text format for sending data that uses tags, similar to HTML tags, to show how IC data relates into the IC schema. An example of an IC XML data schema is shown below:

Web Services
Sharing IC data between stakeholders is a method to communicate the presence and impact of ICs. An exchange permits the machine-to-machine sharing of structured and unstructured data using understood protocols.
Web services have an inward and an outward data flow. The tools used depend on if the shared data are unstructured (such as a PDF or a photo), or structured (such as an IC XML data for an IC.) When unstructured data are shared, the web forms allow for both the upload and the download of files. The user typically manually performs these transfers.
When structured data are shared, the transfer is often machine-to-machine using data transfer protocols. When XML data are transferred, a common protocol used is the RestFUL (Representational State Transfer) protocol.
Purpose of Web Traffic Optimization
The effectiveness of any web site presence for public use is only as strong as the discovery of the information by those parties that would be impacted by the knowledge. The paradigm of information discovery is the Internet either through organic search (such as Google search), paid ads (Google Ads, or LinkedIn), or through social discovery in systems like Facebook.
This web traffic optimization is accomplished by adding hidden features to web pages that automated website data crawlers that search engines employ, calibrating website content for discovery in organic search engines like Google and Bing, paying for search discovery using Google Adwords, and promoting the website through social media pages that would show on sites as Facebook or LinkedIn. The search and social media is optimized by measuring the performance, and if paid approaches are applied optimizing the spending based on effectiveness of paid search.
Effective web traffic optimization includes the following elements:
- Preparing Your Website for Search and Social Discovery
- Organic Search Discovery
- Paid Search Discovery
- Social Web Discovery
- Search and Social Analytic Tools
Program Elements for Web Traffic Optimization
The program elements of web traffic optimization should increase stakeholder awareness of the web resource and the traffic would demonstrably increase. As in Figure D-4, we seek to bring a stakeholder to the web site through a variety of approach, and monitor the effectiveness of various discovery approaches.
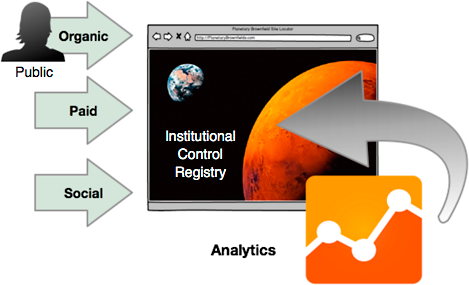
Figure 13. Web traffic optimization.
Source: Courtesy Bob Wenzlau, Terradex.
Preparing Your Website for Search and Social Discovery
To be discovered, the website should be search engine-friendly and include specific content optimized for search engine placement. Search engines are smarter, and can judge the quality of the content, and the popularity of the content. Several of these elements are shown in the graphic below of the inside view of our website.
- Indexable Content. – crawlable link structure including the Anchor Tag and meta tags.
- Anchor Text. Anchor Text is the visible, clickable text in a hyperlink (URL). In modern browsers, it is often blue and underlined. Well formed anchor names using key words informs crawl tools. (link)
- Meta Tags. Hidden in the Header of the web page, are direct messages to search engine crawling tools.
- The title element of a web page is meant to be an accurate and concise description of a page’s content. (link)
- Provide concise explanations of the contents of web pages. Meta descriptions are commonly used on search engine result pages (SERPs) to display preview snippets for a given page. (link)
- Key Words. Are are the key words and phrases in your web content that make it possible for people to find your site via search engines. (link)
- A small file in the root web directory that tells search engines data on the pages of a site they want crawled as well as the priority or hierarchy of site content alongside information on when the page was last updated. (link)
- Relevance or Keyword Narrative. The keywords should be relevant to the narrative and image content of the site. “The real trick is developing (targeted) keyword relevant targeted that can actually gain the popularity it needs to help you rank.” (link) (link).
- Tracking Codes. Small web scripts are place in the Footer of the web page to send usage information to social analytic site.
- Social Sharing. Sharing to Facebook, Google+, LinkedIn. The social sharing may influence organic search ranking.
Organic Search Discovery
Organic discovery includes Google Search (with 67% market share), Bing, Yahoo, LinkedIn etc. Search engines have two major functions: crawling and building an index, and providing search users with a ranked list of the websites they’ve determined are the most relevant. An example from Google shown below, Paid Search results shown on right of panel.
- Search Engine Ranking. Overall placement when search results return – top is best.
- Crawling, Spidering and Robots. A collection of terms related to the agents used by search companies. Broadly these agents follow anchor tags or site maps to discovery searchable websites. Tags exists that direct “no robots” to ask that certain portions of websites not be indexed. (link)
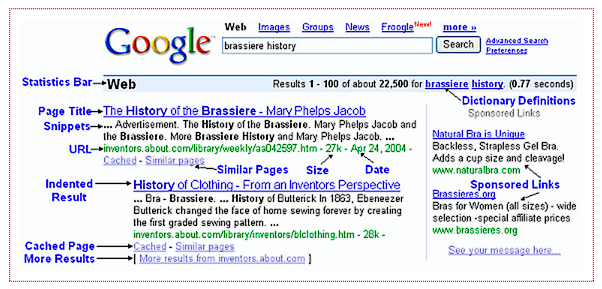
Figure 14. Google search index, screenshot.
Source: Courtesy Bob Wenzlau, Terradex.
Paid Search Discovery
Basically advertisements that are placed in search engines or on websites that seek to make revenue by displaying ads. Strategist are striving to get the most out of organic search given the spending that paid search requires. The graphic shows the relationship between Ad Groups and Campaigns.
- Campaign Goal. Set a goal – Increase Targeted Traffic, Increase Sales, Become a resource, increase visibility, establish brand in social media – the goal directs the campaign. (link)
- Campaign and Ad Groups. Within the Google AdWords or Facebook account, the campaign is where the budget is set. Beneath a campaign multiple ad groups can deploy different ads with different keywords. (link)
- Target Audience. Google ads now targeting features place less emphasis on the keyword and more focus on the audience. Targeting includes day, location, types of locations (school), device, or weather. Also interest categories such as “cares about environment”, or demographic (age and sex). (link)
- Cost Per Click (CPC) – Is an Internet advertising model used on websites, in which advertisers pay only when their ad is clicked, not each time an ad is shown. Fee model applies to Google Adwords, Facebook and LinkedIn.
- Cost Per Impression (CPM) – Is an Internet advertising model used on websites, in which advertisers pay for the number of times an ad is show regardless of whether it is clicked on or not.
- CPC vs. CPM. In most cases, using a cost per click payment model is the most beneficial for businesses advertising online. The one exception where it is not clear is Google Adwords (link)
- Daily or Lifetime Campaign Budget. There are multiple modes to control the spend. Limiting the reach of early campaigns allows determining effectiveness as measured by analytic tools.
Social Web Discovery
Social Sharing includes Facebook, Google+, Twitter, and Yelp. The website appears in the context of the user’s social interactions. With social web discovery one promotes content to enable discovery while the user interacts with the social website. To complicate matters, most social sites carry search engines, but the search domain is generally limited to the content that they catalog, not the entire web as organic search performs. Social discovery may well bring in the best quality audience to the website.
- Forecast of audience count based on campaign demographics. On Facebook, post reach is the number of people who have seen your post. Your post counts as reaching someone when it is shown in News Feed.
- Organic reach is the total number of unique people who were shown your post through unpaid distribution. Paid reach is the total number of unique people who were shown your post as a result of ads.
- In the context of the social web, engagement means that customers and stakeholders are participants rather than viewers. (link)
- Influence is the ability to drive action, such as sharing a picture that triggers comments and likes, or tweeting about a great restaurant and causing followers to try it for themselves. Social actions are a signal that friends and peers in social networks have been influenced by content. Influencers links to the site will influence placement in search engines. (link)
- Same as keywords, but overt in social posts.
- Social media optimization (SMO). Social media optimization is becoming an increasingly important factor in search engine optimization, as search engines are increasingly utilizing the recommendations of users of social networks such as Reddit, Facebook, Tumblr, Twitter, YouTube, and Google+ to rank pages in the search engine result pages. (link)
- On Facebook, a Page is created which would correspond to a web page that an agency might hold.
Search and Social Analytic Tools
There are multiple free and paid approaches to measure and diagnose web site and campaign performance. Measurement is imperative to optimizing results, but requires vigilance. An example of Google Analytics is shown in Figure 15.
- Website Analytics Tools. Google Analytics allow measuring whether web traffic originates from organic, paid or social. Some other third party paid providers, such as Moz, offer a suite of tools with support.
- Website Performance. These tools analyze the website for organic search. A commonly used free version is Google Webmaster Tools or Search console evaluates site for organic search. (link)
- Social Analytic Tools are applied to metrics within a social site such as Facebook or LinkedIn. Facebook applies Page Insights to reveal analytics with the website. LinkedIn maintains an Analytics Tab that reveals demographics.
- A conversion is a customer action that has value to your business, such as purchase, downloading an app, visiting a website, filling out a form or signing a contract. Online and offline actions are called conversions because a customer’s click translated – or converted – to business. (link)
- Redirection is the process of forwarding one URL to a different URL. They can be an adverse symptom for website performance. There are three main kinds of redirects: 301, 302, and meta refresh. (link)
- Click-Through-Rate (CTR). The purpose of click-through rates is to measure the ratio of clicks to impressions of an online ad or email marketing campaign. (link)
- Bounce Rate. – It represents the percentage of visitors who enter the site and then leave (“bounce”) rather than continuing on to view other pages within the same site. (link)
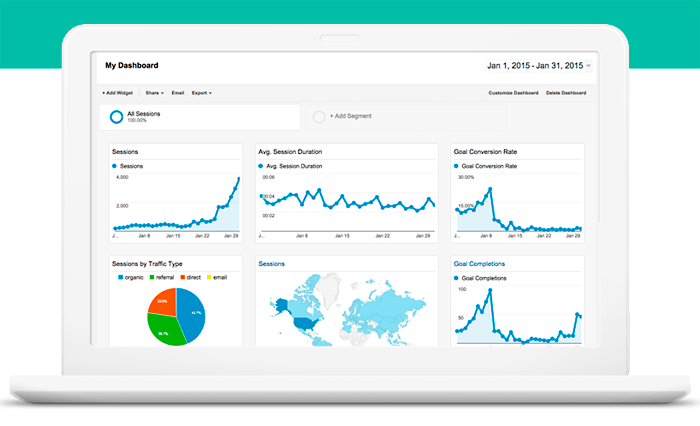
Figure 15. An example of a Google analytics report, screenshot.
Representative IC Data Management Programs
Indiana
Indiana’s Institutional Control Registry is composed of 5 components: 1) a relational database management system used by the Indiana Department of Environmental Management (IDEM) to track ICs and generate internal reports, 2) a GIS system that stores polygons of areas restricted by ICs and provides an internal GIS viewer for state government staff, 3) a public-facing website (https://www.in.gov/idem/cleanups/2358.htm) listing implemented ICs and information about the associated property, 4) a layer on the official Indiana state atlas, IndianaMap (http://www.indianamap.org), showing the boundaries of IC-restricted areas and attributes of those areas, and 5) a public- and internal-facing records repository (called the Virtual File Cabinet) that provides access to all IC-related documents received by or published by IDEM. To facilitate direct access to the IC-related documents, links to the documents are stored in the RDBMS and included as hyperlinks on external reports and the IndianaMap layer.
Indiana accepts proposed IC boundaries as either metes and bounds property descriptions or GIS polygon files provided that all points meet IDEM’s 1 foot horizontal accuracy standard. All proposed restricted areas submitted as metes and bounds legal descriptions are converted by IDEM data services personnel into GIS polygons, which are then reviewed by IDEM project management staff to ensure they accurately portray the area(s) to be restricted.
Indiana currently uses the Exchange Network’s Facility Identification (FacID) dataflow to automatically update Environmental Protection Agency (EPA) databases with IC-related facility information, but does not currently publish data in the Exchange Network’s IC data schema.
Indiana’s IC Registry received an Environmental Council of the States (ECOS) Innovation Award in 2013.
USEPA
The EPA regains information regarding EPA-lead superfund sites, but typically leaves the GIS data management to the state.
The EPA is transitioning to a new information system, the Superfund Enterprise Management System (SEMS), for their project records. SEMS is a replacement for the Institutional Controls Tracking System (ICTS) for ICs. The US EPA maintains limited information for ICs implemented under RCRA and Superfund, but this information generally does not include monitoring, compliance, or enforcement information. They do function in terms of distributing information to stakeholders. The two main systems are RCRAInfo and SEMS. External stakeholders may search for information on sites at the website.
Private IC Tracking Companies
Various private companies are stakeholders in the monitoring, tracking, and compliance with ICs. These companies have made significant strides in the effort to integrate IC information across potential IC management tools such as one call systems and local land use permitting systems.
Model Best Practices for Data Management
- Use relational databases to accommodate the nature of IC data.
- Use a geospatial database that can resolve the boundaries of ICs.
- Apply the IC XML data standard to the organization of IC data
- Enable data transfer protocols for structured XML data in the IC XML schema
Examples of State, Federal and Commercial Registries
New Jersey IC Registry
ICs are cataloged within the New Jersey Department of Environmental Protection (NJDEP). The catalog includes proprietary controls, governmental controls, and enforcement status. The status reflects whether the holder of the IC is current with IC-related compliance obligations. Proprietary ICs are designated as “Deed Notices” in New Jersey. New Jersey is unique in in that these Deed Notices are enforceable by statute and regulation. The NJDEP catalogs an IC by entering the ICs into the registry, and enables the user to obtain information about the site, use restrictions, and a variety of other information that maybe of interest
Entering ICs to the Registry
Most documents received from outside of the agency are processed and entered through the Bureau of Case Assignment and Initial Notice. This bureau performs an administrative review of the submission for administrative completeness. In establishing an EC or IC for a site, the bureau creates an ‘Activity Bar’ (Figure 16). The Activity Tracking Task (the first “Activity and Documents” listed in Figure 16) captures the permit processing steps and completion dates. This step also captures the future biennial certification submission due dates and agency inspection schedules (every five years). The permit issued contains all future biennial certification due dates for the person responsible for conducting the remediation.
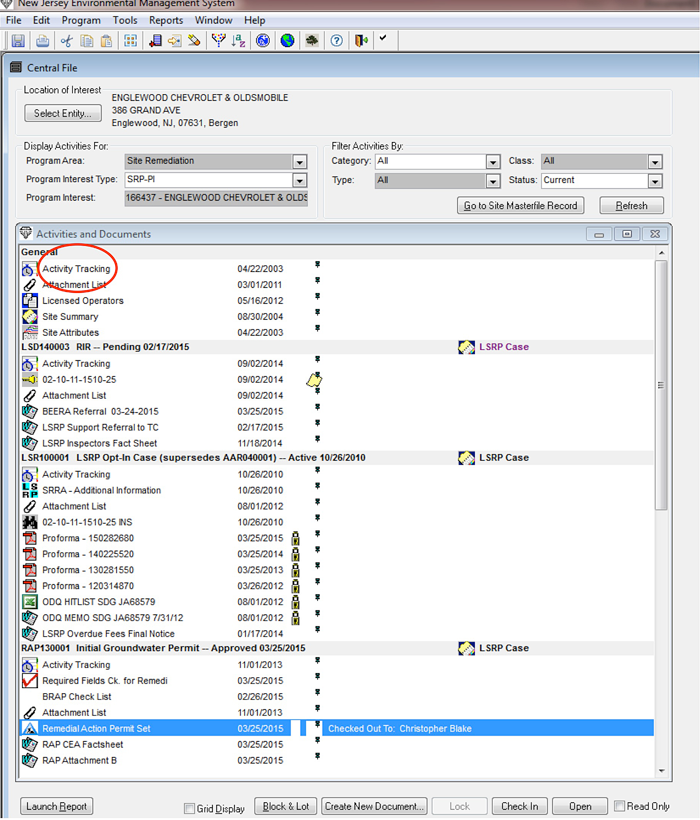
Figure 16. Central file of initial groundwater permit, screenshot
Source: Courtesy Bob Soboleski, New Jersey.
Specific details describing the IC are either brought forward from other existing activity bars, or entered as necessary. This process includes information such as the classification exception area (CEA), shown in Figure 17, well restrictions, groundwater flow direction, contaminants, and concentrations, and estimated duration of the CEA. Similarly, for a parcel that has a Deed Notice and an engineering control, this information is captured in the Deed Notice Detail windows.
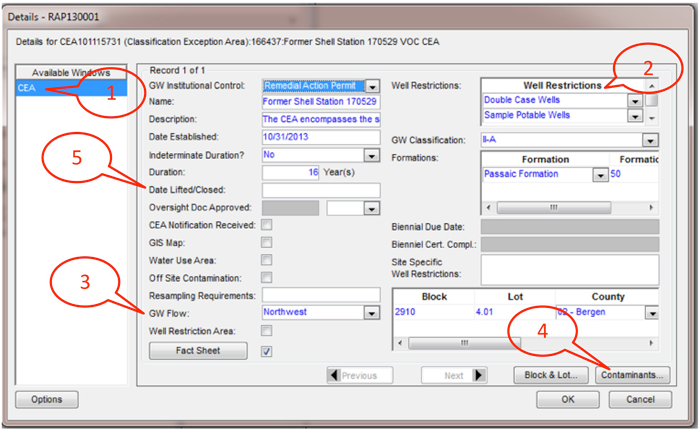
Figure 17. Classification Exception Area (CEA) window, screenshot.
Source: Courtesy Bob Soboleski, New Jersey
(Figure 18). Additional subscreens capture financial assurance information and monitoring or inspection requirements by the responsible entity. The entire permit document contains a copy of the filed Deed Notice and supporting exhibits and site maps. Site maps (Figure 19) and restricted areas are entered electronically through the New Jersey Bureau of Information Services. The permit writer verifies location, shape, and size. Note that in the ‘Attachment List’ (hanging window) are links to PDF copies of the document submissions (Remedial Action Report or Receptor Evaluation Report) for internal use or future reference. These documents will eventually be available to the general public through DataMiner.
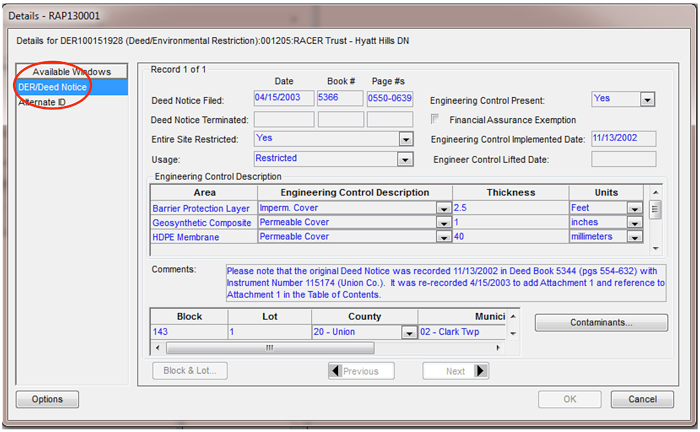
Figure 18. Deed Notice detail window, screenshot.
Source: Courtesy Bob Soboleski, New Jersey
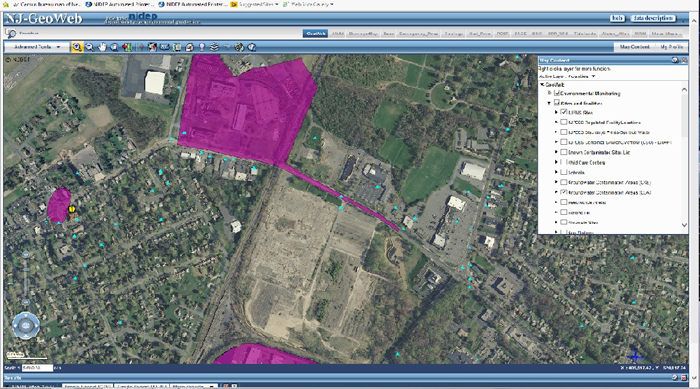
Figure 19. Site map.
Agency View of the Registry
The Central File is the main agency view and starting point for the registry. Clicking through the electronic detail leads to other screens containing various site and internal information such as date assigned and to whom, the bureau, and case type (for example, NPL),
Public View of the IC Registry
The public can locate a site using GeoWeb (Figure 20) based on street address, Program Interest Number, or other means. On the Mapped Deed Notice GeoWeb Screen, two boxes guide user choices. CEA or Deed Notice information is located under ‘Sites and Locations’, which is opened in the top screen. Clicking on any of these boxes highlights the mapped CEA or Deed Notice area, or other nearby features that may be of interest (schools, child care centers, gas stations, dry cleaners, chromium contaminated areas, or areas of historical fill) that may be sensitive receptors. Other regional information is shown on additional map layers, such as Pinelands Preservation/Management Areas, wellhead protection areas, water purveyor areas (waterlines), and site parcel information (lot and block).
The left side of the screen includes additional site information: the site designated PI (Program Interest) number, address, acreage, contaminants, lead bureau for the site, and site mapping coordinates (see Figure 20).
The Site Remediation Program webpage (Figure 21) includes various site listings that can be found for sites with a deed notice or CEA (by municipality, county). Each site address and PI number can be located by clicking the ‘Data Miner’ button on the lower left. The ‘Data Miner” might be the starting point to find a specific site PI number or other information to obtain additional information in GeoWeb.
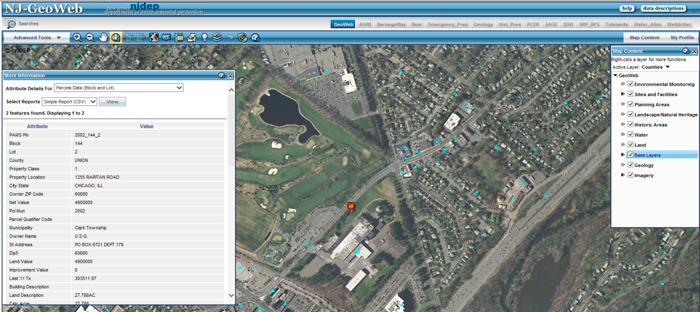
Figure 20. Parcel information, screenshot.
Source: Courtesy Bob Soboleski, NJ
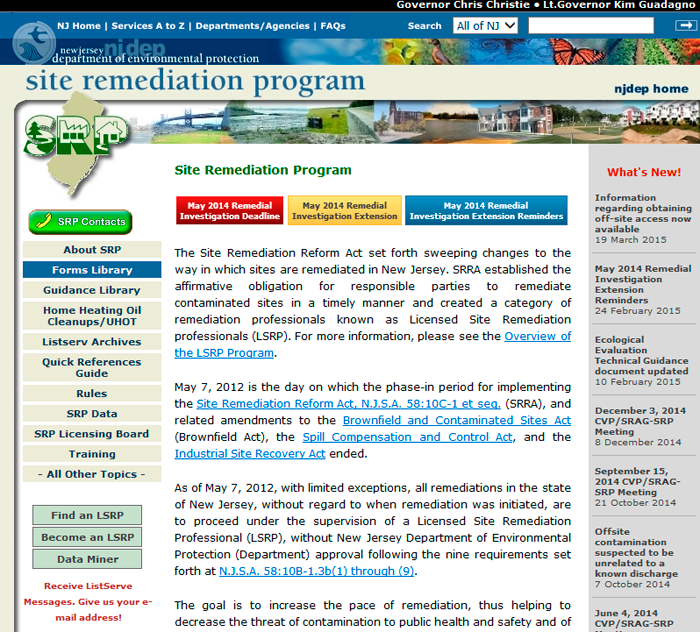
Figure 21. NJDEP Site Remediation Program webpage, screenshot.
Source: Courtesy Bob Soboleski, New Jersey.
California Department of Toxic Substances Control IC Registry
California maintains two separate registries of ICs: one registry at the State Water Resources Control Board within the GeoTracker services, and a second registry at the Department of Toxic Substances Control (DTSC) Envirostor system. While there are two registries, this overview focuses on the California Envirostor Registry. The GeoTracker system is similar, but separate. Additional views of the DTSC system are included at California Registry site.
Entering ICs into the Registry.
A project manager at DTSC creates as an “activity” in the database of an IC (deemed an environmental covenant or deed restriction). This action generates a form that captures the steps necessary to create the IC with associated draft and final deliverables. The landowner is the recording party, and DTSC is an identified third party beneficiary. With the acceptance by DTSC of the draft IC, and the recording by the landowner, the DTSC receives the recorded IC directly from the county recorder’s office of the county.
The project manager scans the recorded IC and uploads the document within the IC activity form. Within the DTSC database, one of the final steps is choosing the “Restricted Uses” from a dropdown menu. The project manager also sets any new affirmative obligations in their database system. If known, the Project Manager can identify the affected parcel ID identification numbers (PINs) or associated parcel numbers (APNs). When the IC is selected as final, the document then becomes publicly visible within the DTSC registry. The screen shot below (Figure E-7) displays the opening page of a Site Register.
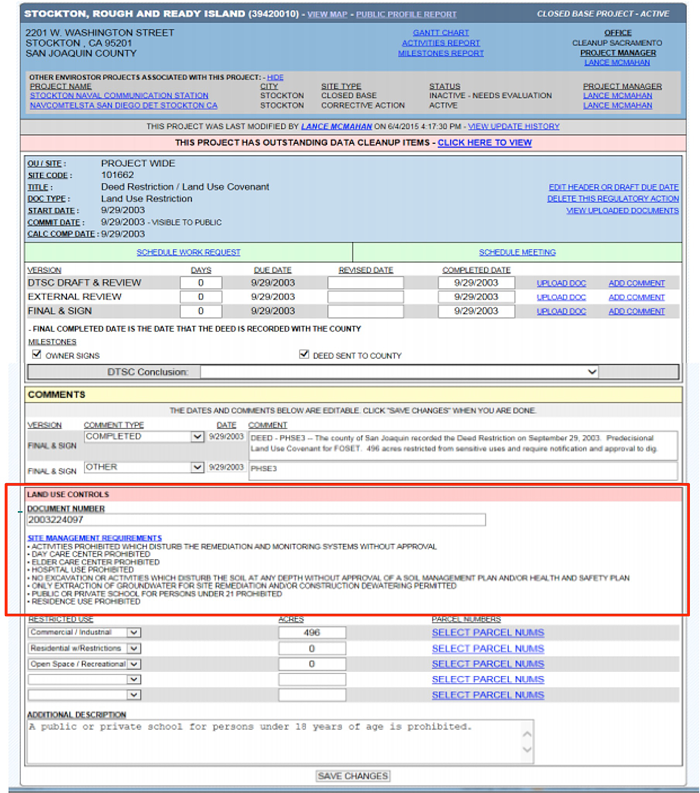
Figure 22. Screen shot of the opening page of the California DTSC Registry. The red box highlights the land use controls on the site, screenshot.
Source: Courtesy Kevin Shaddy, California DTSC
Agency View and Use of the IC Registry.
An IC registry is formed through search within the EnviroStor platform (see Figure E-8). This search approach provides for not only discovery of sites with ICs, but also listings of affirmative obligations such as inspections that are pending.
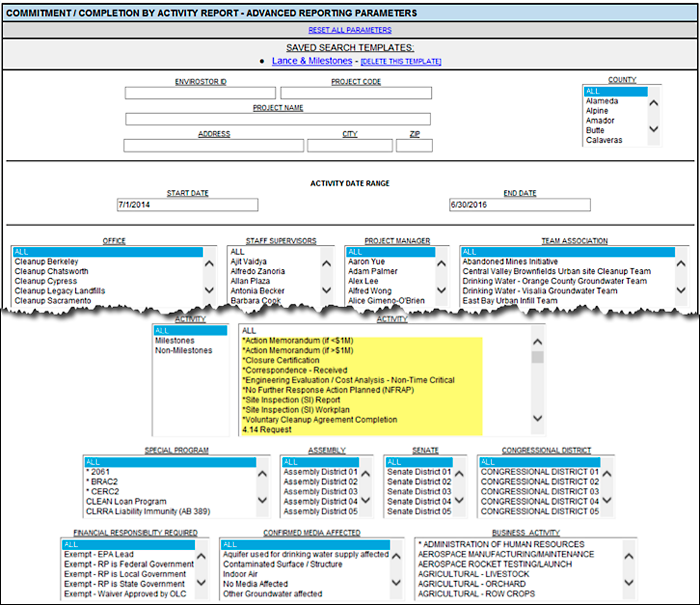
Figure 23. Search parameters on EnviroStor platform, screenshot.
Source: Courtesy Kevin Shaddy, California DTSC.
Public View and Use of the IC Registry.
The public view of the IC registry on EnviroStor consists of search, grid view, and map view.
- Search. ICs are discovered as a listing from the home page of EnviroStor (Figure 24). The red arrow notes the ‘Land Use Restriction’ link, There is no direct way to search for an IC (Land Use Restriction), but a public user may sort the IC listing by column headers, which include City, zip code and address. A public user may also search for an address in the EnviroStor database and click the site to see whether ICs apply. The IC listing may also be exported as an excel file.
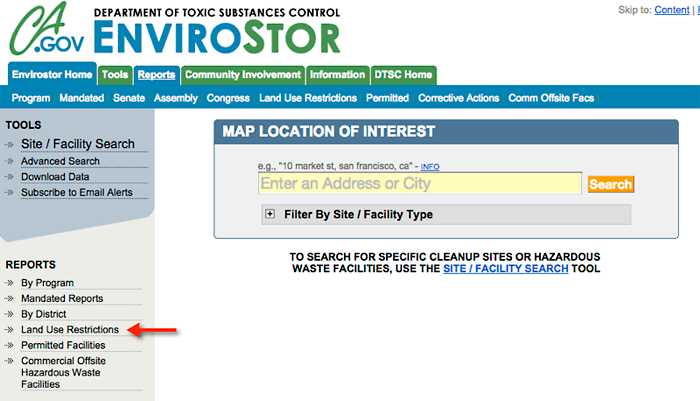
Figure 24. EnviroStor opening page, screenshot.
Source: Courtesy Kevin Shaddy, California DTSC.
- Grid View. When land use restrictions are selected as a link from the EnviroStor home page (see red arrow in Figure 24), a listing of ICs is displayed (Figure 25). The listing contains hyperlinks to the covenant document, a map of the site (as a pin), and a link to the site summary page on EnviroStor. The listing may also be sorted by clicking on any of the column headings, which allows the user to locate ICs within a City, zip code area or by address.
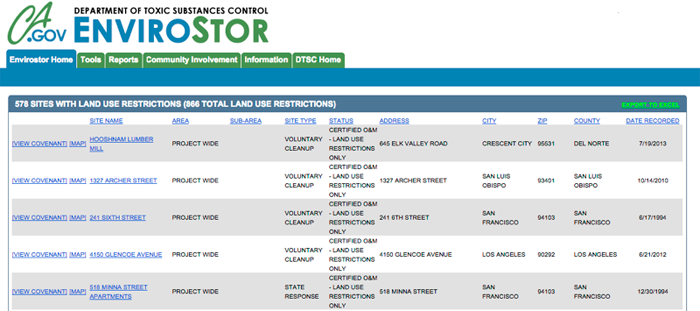
Figure 25. EnviroStor IC page by address, screenshot.
Source: Courtesy Kevin Shaddy, California DTSC.
If the public user chooses to learn more detail on the IC, an IC detail page opens (Figure 26). This page shows the land use restrictions and a link to the covenant.
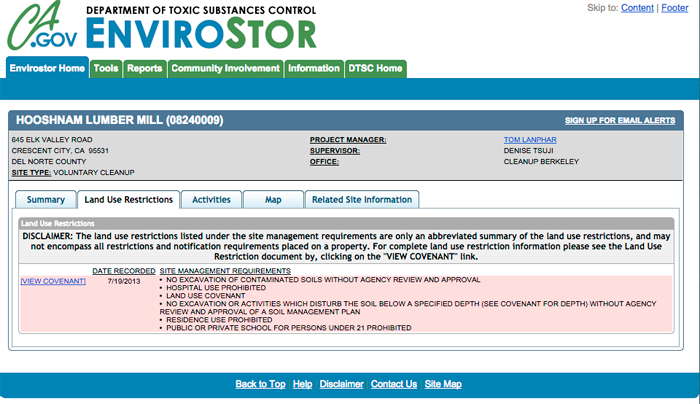
Figure 26. EnviroStor IC details, screenshot.
Source: Courtesy Kevin Shaddy, California DTSC.
- Map View. The map view (Figure 27) does not directly reveal a site with an IC, but when the site is clicked, the information balloon displays the land use restrictions for the site.
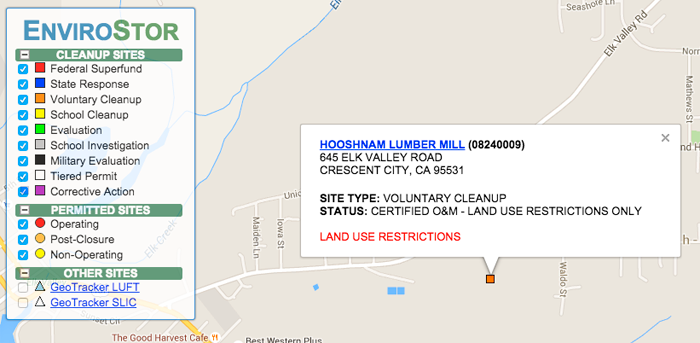
Figure 27. IC location map, screenshot.
Source: Courtesy Kevin Shaddy, California DTSC.
Missouri IC Registry
The Missouri IC registry is maintained by the Missouri Department of Natural Resources (MDNR). The registry is encompassed by the Site Management and Reporting System (SMARS). A review of the Missouri IC Registry is available at the Missouri SMARs overview.
Entering ICs into the Registry.
MDNR maintains an internal multiuser database that allows the characterization of ICs. All attributes except the geographic boundaries of the IC are entered into SMARS including restrictions, affirmative obligations, and monitoring results. The SMARS database organizes IC obligations with an LTS section of the database (Figure 28).
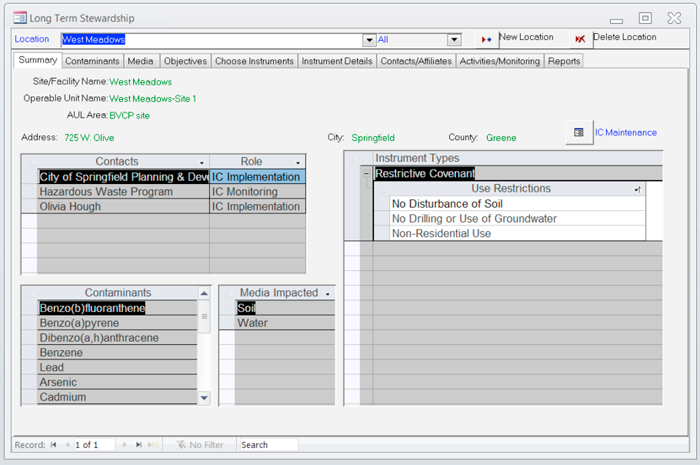
Figure 28. Internal IC profile page within the SMARS system, screenshot.
Source: Courtesy Bob Wenzlau, Terradex.
The sections include structured entries allowing for the near complete characterization of an IC (Figure 29).
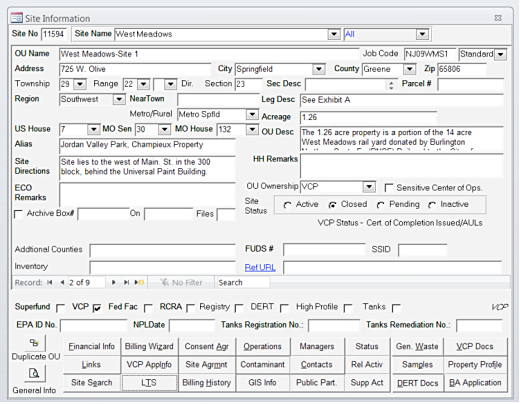
Figure 29. Site information within the SMARS system, screenshot.
Source: Courtesy Bob Wenzlau, Terradex.
Public View and Use of IC Registry.
MDNR maintains an LTS web page, which introduces the duties of MDNR to manage postremedial obligations. The page also describes LTS tools to the public. Additionally, the page links to the Hazardous Substance Site Locator.
A public user can search for a cleanup site by county, city zip code, or specific address. Color-coding differentiates cleanup sites into four categories: active, LTS sites, environmental notice, or cleanup completed (Figure 30).
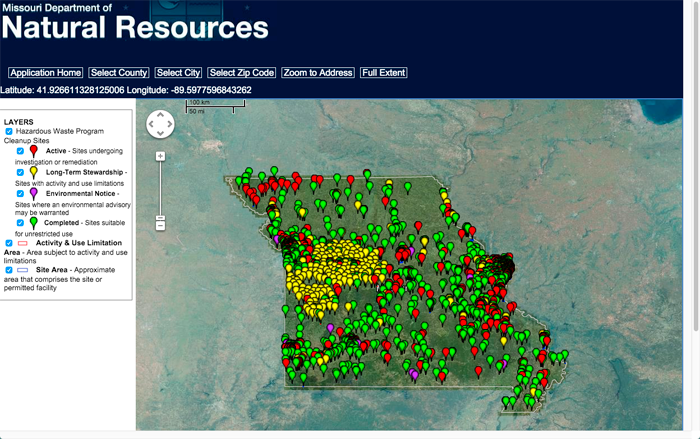
Figure 30. Public page offering the public a quick description of the status of the long-term stewardship of a site including ICs, screenshot.
Source: Courtesy Bob Wenzlau, Terradex.
As a search for a cleanup site is completed, for sites with ICs, the map shows “Activity” and “Use Limitation” areas as a polygon. The cleanup site icon is clickable, and reveals an information balloon identifying the activity and use limitation with a link to a detailed summary of the activity and use limitation (Figure 31).
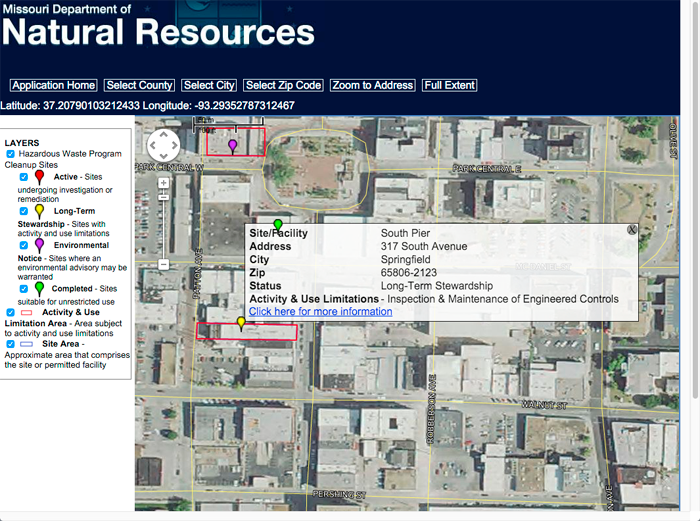
Figure 31. Site map within the SMARS system, screenshot.
Source: Courtesy Bob Wenzlau, Terradex.
Washington State IC Registry
The IC catalog in Washington State is part of an internal database (Integrated Site Information System) maintained by the State Department of Ecology (WA DOE Integrated Site Information System). This database is not limited to proprietary controls and government controls (easements, permits) and also includes other types of alternative ICs.
Entering ICs into the Registry.
The cleanup site manager is part of the decision-making and approval process for an IC to become part of a remedy, therefore discovery occurs automatically. For proprietary controls, the agency provides a draft of the IC to the property owner for recording. After an IC is recorded, the original is returned to and held by the agency.
Once an IC has been implemented, it is scanned and uploaded and the details of the IC are entered into the internal database, including any required future activities associated with the IC (such as a five-year review). IC data are entered into Washington’s internal database by a WA DOE cleanup site manager (or administrative staff serving that cleanup site manager) upon discovery.
Agency View and Use of the IC Registry.
The agency view of the IC registry is part of the internal database that contains a description and cleanup data for all sites in Washington’s cleanup program. IC data are found in a subsection of this database (Figure 32) and contains a list of required activities or obligations associated with an IC. The Institutional Control link is highlighted in blue within the left bar.
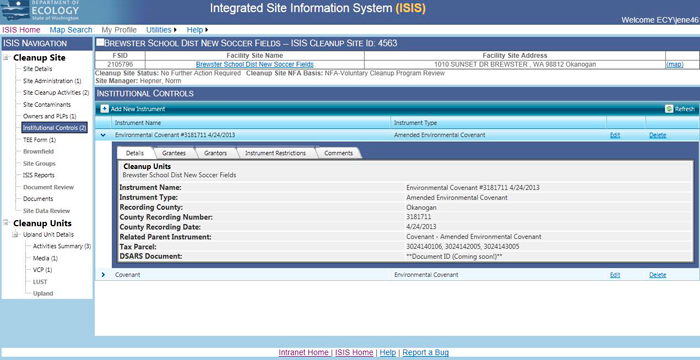
Figure 32. Washington State Department of Ecology Integrated Site Information System (ISIS) site opening page, screenshot.
Source: Courtesy Bob Wenzlau, Terradex.
Public View and Use of the Registry.
Public view of the IC registry in Washington is provided through a web reporting tool. This tool allows the user to search by parameters such as address, city, agency, and region. The results are provided in a variety of tabular forms (Figure 33). A map search is not available.

Figure 33. Washington Department of Ecology IC Registry site information page, screenshot.
Source: Courtesy Bob Wenzlau, Terradex.
Idaho Remediation Facility Mapper
Entering ICs into the Registry.
Once an IC is received, the IC information is entered into two systems. The HP Trim system stores the document associated with the IC along with other remedy documents. The IC boundary is delineated into a polygon by departments mapping staff.
The data within the TRIM system and GIS are consolidated into a web platform that contains both mapping and documentation. The platform maintains backend access for the Idaho Department of Environmental Quality (IDEQ) staff to characterize the ICs, and then confirm that the characterized ICs are visible for public review.
Agency View and Use of IC Registry.
The Idaho registry of environmental covenants is a web-based display offering both grid and map view. The grid view supports search for ICs by type of IC, city, address or other keyword search (Figure 34). The response summarizes IC conditions, carries a link to the associated covenant, and a view to the map.
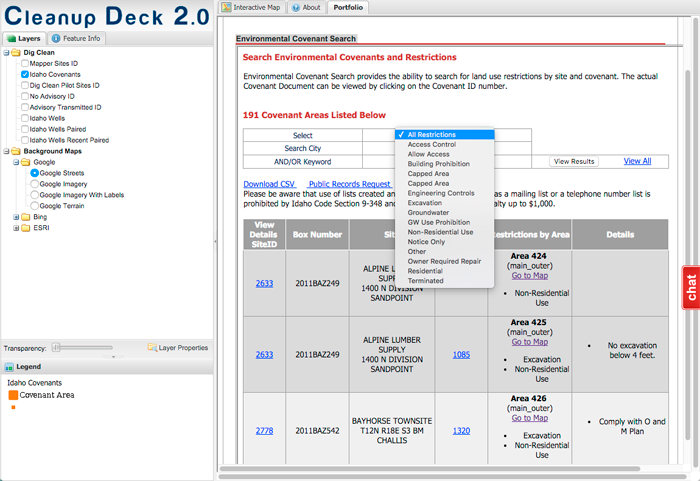
Figure 34. IDEQ remediation facility mapper.
Screenshot courtesy Bob Wenzlau, Terradex.
The map represents the boundary of the IC and other map features, as well as IC monitoring data that can be shown as an overlay. The feature is responsive to a click, allowing basic IC information to be shown while browsing the map (Figure 35).
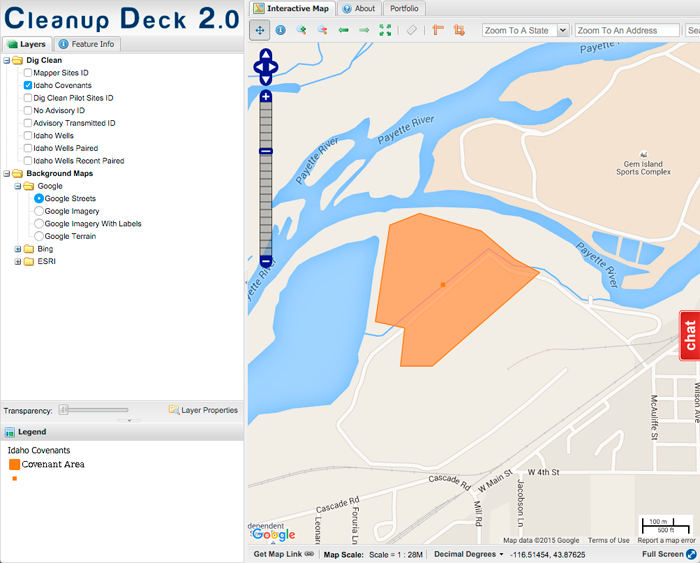
Figure 35. Example data overlays using IDEQ facility mapper, screenshot.
Source: Courtesy Bob Wenzlau, Terradex.
The mapping system’s organization is responsive to the hierarchy of a site that may have multiple ICs. Through the search function, a user can find one site, then discern that the site has multiple ICs, and that these ICs may affect multiple noncontiguous areas.
Public View and Use of IC Registry.
The IDEQ maintains a facility mapper that displays the occurrence of ICs (Figure 36). This searchable map allows the public to discover cleanup sites by program as well as by keyword search by site name. When covenants are present, a tab is revealed to allow download of the instrument.
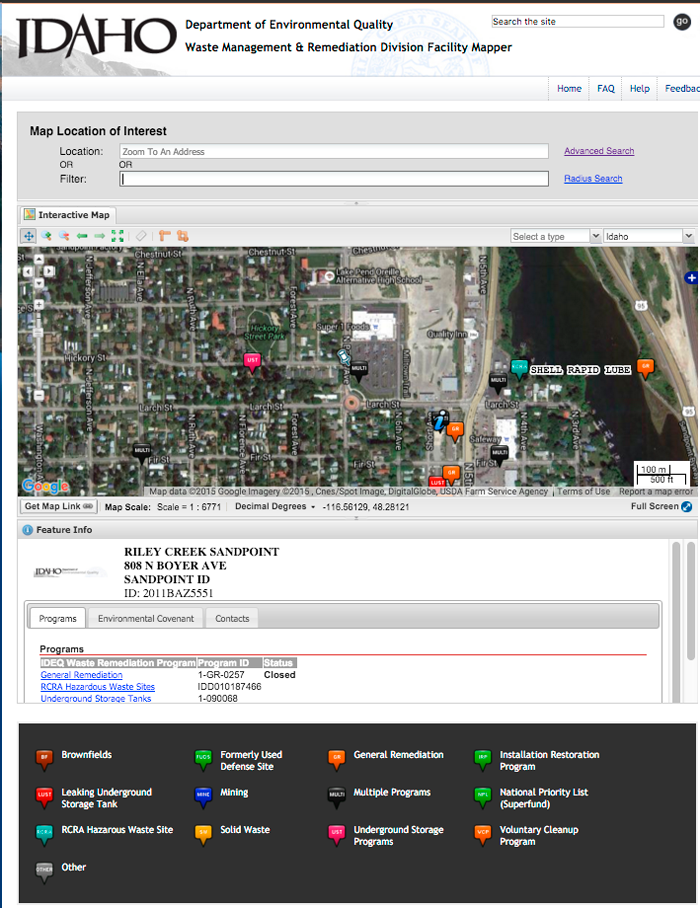
Figure 36. Public view of IDEQ facility mapper, screenshot
Source: Courtesy Bob Wenzlau, Terradex.
Navy IC Registry
The Navy maintains the Land Use Control (LUC) Tracker. The LUC Tracker is representative of a sophisticated inventory used by a responsible party.
Navy LUC Tracker Home Screen
The “Home” screen requires the selection of a region and installation to display any data. In the screenshot below, the user has selected “WASHINGTON, INDIAN HEAD” (Figure 37).
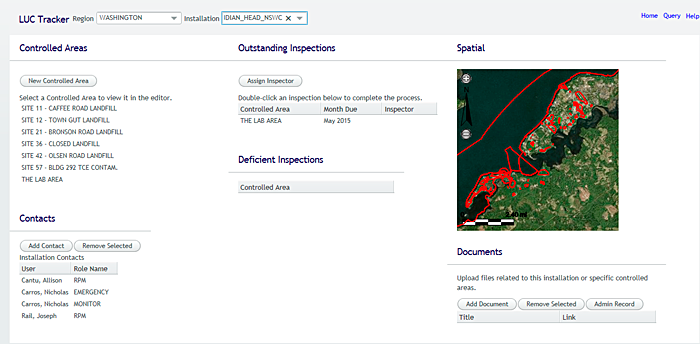
Figure 37. Dropdown box used to select a region or installation, screenshot.
The screen is divided into several sections consisting of a menu bar across the top and a data display area in the middle. The data display area is divided into the controlled areas, inspections that are Pending or have a Control violation, and installation map for the selected area. From this screen the user is able to perform the following tasks:
- Add a new controlled area.
- Edit an existing controlled area.
- Begin an inspection task.
- View inspections that have a violation or other deficiency.
- View, add, and remove documents.
- View, add, and edit contacts.
- Access the installation Administrative Record.
- View the installation map.
- Access the WEBGIS.
- Access the LUC Tracker Query tool.
Controlled Area
A specific LUC is made up of several components that describe the controlled area. These components include the factors, problems, and remedies used to track and control the individual parcel. Following is a sample hierarchy (Table 8) that describes the different types of components and their placement.
Table 8. Hierarchy within the Navy LUC Tracker
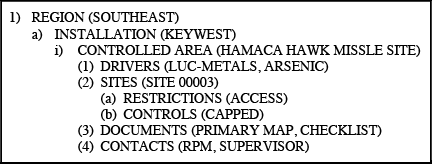
The editor screen is divided into two tabs (Figure 38) with the Controlled Area tab for entering data regarding a LUC and the Inspections tab for addressing pending and unresolved inspections or viewing past inspection reports (or viewing closed inspections).
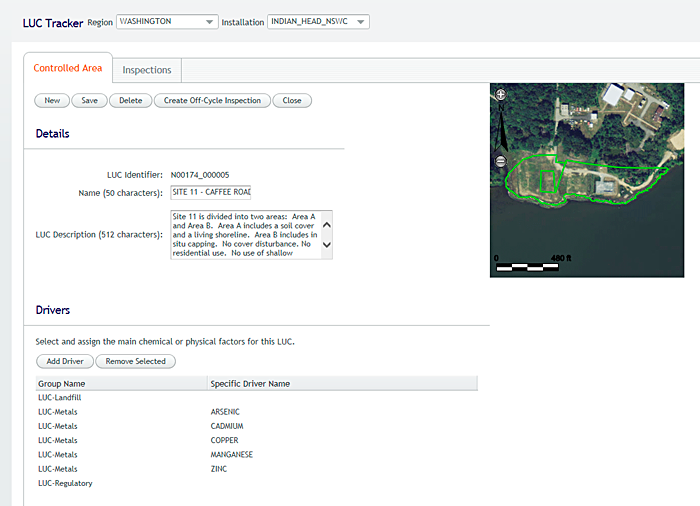
Figure 38. Editor screen of the Navy LUC Tracker, screenshot.
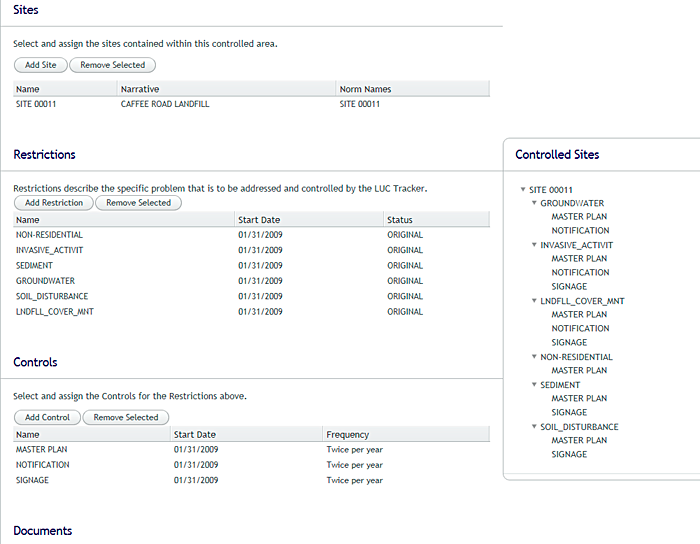
Figure 39. Controlled Area tab screenshot.
From the Controlled Area Tab (Figure 39) the user can add the full definition for a LUC including drivers, sites, restrictions, controls, documents, and contacts.
From the Inspections Tab (Figure 40) the user can:
- Start a pending inspection task for a specific site/project.
- Complete an inspection task.
- Review a closed inspection.
Navy View and Use of IC Registry.
This Navy LUC Tracker system is not publicly available but the results of the inspections are available as part of the five year reviews and other site specific reporting documents. The Navy must approve users for access to the Navy LUC Tracker to maintain security at the installations. The Navy RPM and the appropriate managers within the Navy can access the information. The information may be made available to other stakeholders who need access and have the required security clearance.
Inspections. In addition to recording information about a specific controlled area, the LUC Tracker contains an inspection module (Figure 40) used to ensure each of the remedies are being properly maintained and are without damage or deficiency. LUC Tracker supports automatic notifications as controls become due for inspection and also an Inspect Now feature used to record an immediate or off-cycle inspection activity.
The scheduled inspections feature in the LUC Tracker consists of an automated process that runs on the first day of each month to determine which controls should be presented for inspection in the coming month based on the choices made during data entry. This process accomplishes the following tasks:
- Creates an inspection task that will be displayed on the Home
- Sends a consolidated email with full instructions to the assigned RPM/MONITOR that an inspection is due. The email notification directs the RPM to login to the application and click the task to begin the report.
Once a scheduled or off-cycle inspection is initiated, the Inspection Editor opens and displays the inspection report to be completed in the right hand pane. This tool consists of two panels, with the panel on the left displaying a table for Outstanding and Completed Inspections (Figure E-25) and the panel on the right presenting the inspection questionnaire for each controlled area.
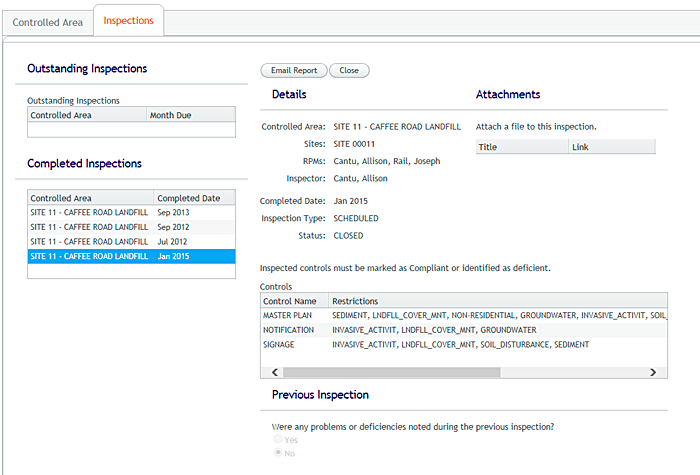
Figure 40. Inspection module tab, screenshot.
The report is divided into several sections that must be completed. The sections are as follows:
Details. The Details section displays basic information regarding the controlled area being inspected including the name, assigned sites, the RPM, the inspector, the inspection type (scheduled or off-cycle) and the status.
Inspection Questionnaire. The questionnaire is divided into several sections and structured as a wizard in which different questions may be presented based upon answers to questions above. The online form includes the following sections: Previous Inspection, Property Use, ICs, Current Inspection, and Corrective Action.
Corrective Action. The Corrective Action section is only displayed when a control is marked deficient as described above.
LUC Tracker Query Tool. A query tool (Figure 41) is available to query the overall application data and also generate reports or provide export output. The screen is a query-builder that presents data choices as dropdown fields used to easily locate and find information. The tool can be used to search within a specific region and site/project or globally system-wide.
Below is an example results screen for all LUC-GROUNDWATER RESTRICTIONS for all sites at NSF-INDIAN HEAD.
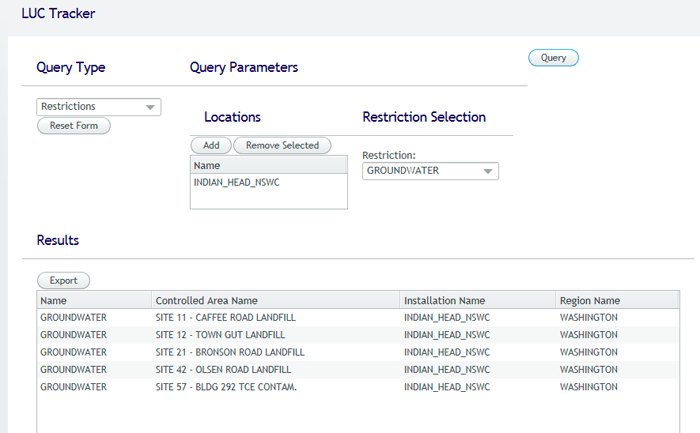
Figure 41. Navy LUC Tracker query tool, screenshot.
The types of queries that can be run in the LUC Tracker include:
- controlled areas
- drivers
- restrictions
- controls
- inspections
Public View and Use of IC Registry.
See E.6.3 for the requirements for public need-to-know and security.
Conveyance of ICs to State Registries
Required reports are generated and provided to appropriate agencies.
Evaluation
This system and process has been tested and restructured to provide a vehicle to capture requirements and make them available to appropriate parties. The module meets the needs of the RPMs to ensure that tracking, monitoring, documentation, and protectiveness are addressed.
Terradex WhatsDown IC Registry
The Terradex WhatsDown registry is representative of a commercial service that aggregates multiple IC registries to form a comprehensive nationwide IC registry. A comprehensive registry is useful when agency geographic jurisdictions overlap, while maintaining separate IC registries. For example, in California two state agencies and the USEPA maintain separate registries covering the same geography. Additionally, WhatsDown interprets the ICs to make them easier to understand and use (for instance, renaming “ICs” as “Environmental Protections”). This representative set of third-party tools offers IC outreach and relies on well-formed data sets obtained from state and federal agencies.
Entering ICs to the Registry.
Terradex collects the ICs by downloading registries from agency databases that are either present on the web or requested through the Freedom of Information Act. The data usually contains location information, information on restrictions, information on points of contact, and links to supporting websites. As part of its data collection, Terradex converts legal descriptions (often shown as metes-and-bounds) to polygon coverage of the IC.
Public View and Use of WhatsDown IC Registry
The IC registry in WhatsDown is called Environmental Protections to inform the public user of the generic purpose of the IC. The registry is responsive to mobile, phone, or desktop use. On a mobile phone, the IC registry obtains the user’s location to target the initial map view to coincide with their current location. This view is shown on Panel 1 of Figure E-27.
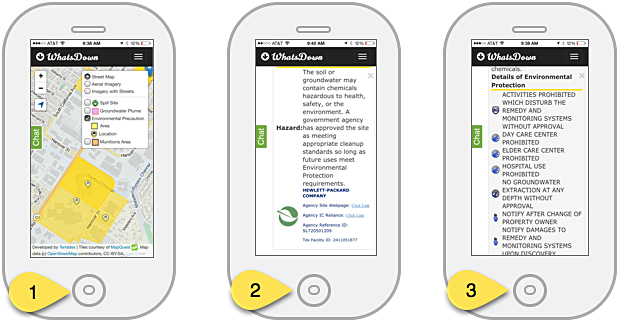
Figure 42. WhatsDown Phone application screenshots. Panel 1 – initial map view, Panel 2 – details of a specific IC, Panel 3 – icons representing categories of restrictions.
Source: Courtesy Bob Wenzlau, Terradex.
The ICs can be viewed in the context of other relevant environmental information including spill sites, groundwater plume extent, and areas containing munitions. The IC is represented by a polygon that is responsive to touch on a mobile device or a click on a desktop. The IC database now includes about 15,000 ICs, but the application should still be considered a work-in-progress.
When the IC area is touched on the screen, a popup window opens to show information about the IC (Panel 2). Links to the IC are shown, as well as an associated state presentation. Additionally, Terradex provides the support for a chat window that allows users to ask questions about an IC. Note that the icons shown for individual ICs on Panel 3 are consistent with the icons for general categories of restrictions.
Users may also share findings using social media tools such as Facebook, LinkedIn, or Twitter. The application provides guidance to help users understand and then apply the information; see the About link on the WhatsDown home page for an introduction to this application.


